Gold has stood the test of time as one of the most reliable stores of value and safe-haven assets. From protecting wealth against inflation to offering stability during economic crises, gold plays a critical role in both personal finance and global monetary systems. However, successful gold investing is not about timing the market perfectly; it is about reading the right signals early.
As of early 2026, gold prices have surged to historic highs globally and in India, driven by a rare combination of currency weakness, geopolitical risk, and policy uncertainty. This blog explains the most important indicators that signal a rise in gold prices, supported by long-term historical trends and practical tips investors can use to make informed decisions.
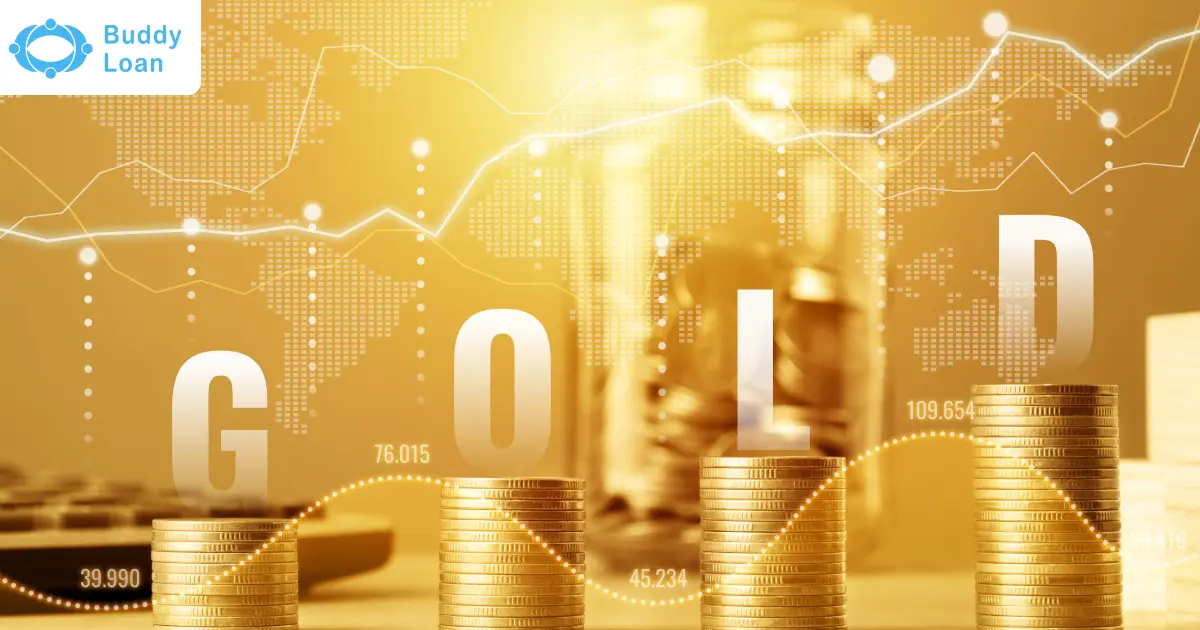
Why Understanding Gold Price Indicators Matters
Gold prices do not move randomly. They react to a combination of macroeconomic forces, currency movements, investor psychology, and supply-demand dynamics. By tracking these indicators consistently, investors can anticipate price trends instead of reacting to them after the rally has already occurred. Whether you invest in physical gold, ETFs, digital gold, or sovereign gold bonds, understanding these signals can help you enter the market at more favorable levels.

1. Inflation and Currency Devaluation
One of the strongest and most consistent drivers of gold prices is inflation.
When inflation rises:
- The purchasing power of paper currencies declines
- Real returns on fixed-income assets fall
- Investors seek protection in hard assets like gold
Gold has historically maintained its value during periods of high inflation, making it a preferred hedge.
Closely linked to inflation is currency devaluation, especially of the U.S. dollar. Since gold is traded globally in USD, a weakening dollar makes gold cheaper for international buyers, increasing demand and pushing prices higher. This inverse relationship between the USD and gold has been a defining feature of gold markets for decades.
2. U.S. Dollar Index (DXY) and Exchange Rates
The U.S. Dollar Index (DXY) measures the dollar’s strength against a basket of major currencies. A falling DXY is often one of the clearest early indicators of a gold price rise.
- Strong dollar indicates pressure on gold
- Weak dollar indicates support for gold
In 2025–26, the DXY fell to multi-year lows, coinciding with gold reaching record nominal prices. Investors closely monitor the DXY, along with exchange rates such as EUR/USD, GBP/USD, USD/JPY, and USD/CHF, to assess global capital flows and gold’s relative attractiveness.
Also Read: USD and Other Currency Impact on Gold Prices
3. Central Bank Policies and Gold Reserves
Central banks are among the largest holders of gold globally, and their actions have a significant influence on prices.
Gold prices tend to rise when:
- Central banks increase gold reserves to reduce reliance on the USD
- Interest rates are cut or expected to fall
- Monetary policy turns accommodative
Lower interest rates reduce the opportunity cost of holding gold, which does not generate interest. In recent years, central banks in emerging economies have steadily increased gold purchases, reinforcing long-term price support.
4. Geopolitical and Economic Uncertainty
Gold thrives during uncertainty. Periods of geopolitical tension or economic instability almost always result in increased gold demand.
Key triggers include:
- Wars or military conflicts
- Trade wars and sanctions
- Financial crises or banking stress
- Global recessions and pandemics
When risk perception rises, investors move away from equities and high-risk assets into safe-haven instruments, with gold often being the first choice.
5. Supply Constraints and Mining Trends
Unlike fiat currency, the gold supply grows very slowly. Annual mine production typically adds only 2–3% to the total above-ground gold stock.
Gold prices can rise when:
- Mining costs increase
- Discoveries slow down
- Environmental or regulatory restrictions limit production
Because supply is relatively inelastic, even modest demand increases can lead to disproportionate price rises.

Get Personal Loan Online Up to ₹35 Lakhs
By entering your number, you're agreeing to Terms & Conditions & Privacy Policy.
6. Cultural and Seasonal Demand in India
India is one of the world’s largest gold consumers, and domestic demand plays a crucial role in price movement.
Gold demand typically rises during:
- Wedding seasons
- Festivals such as Akshaya Tritiya and Diwali
- Periods of high rural income
Seasonal buying pressure, combined with global trends and currency movements, often pushes Indian gold prices higher.
25-Year Gold Price Trend in India (2000–2025)
Historical data highlights gold’s long-term wealth-preservation ability.
| Year | Average Gold Price (₹/10g) | Key Driver |
| 2000 | ₹4,400 | Post-liberalization phase |
| 2005 | ₹7,000 | Rising investment demand |
| 2008 | ₹12,500 | Global Financial Crisis |
| 2011 | ₹26,400 | European debt crisis |
| 2015 | ₹26,344 | Market consolidation |
| 2020 | ₹48,651 | COVID-19 uncertainty |
| 2023 | ₹65,330 | Inflation & geopolitics |
| 2024 | ₹80,450 | Dollar weakness |
| 2025 | ₹1,05,000–₹1,30,000 | Historic global rally |
This trend shows that gold has delivered consistent long-term appreciation, particularly during crisis periods.
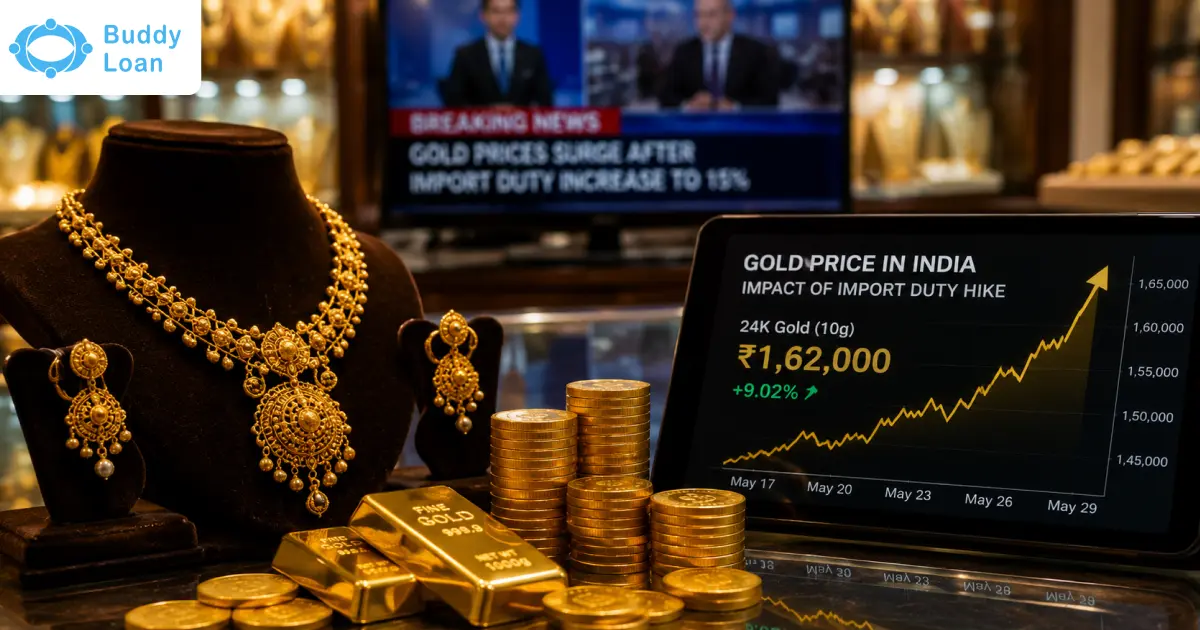
Why Gold Prices Rose Sharply in 2026
In early 2026, gold surged to unprecedented levels due to a convergence of factors:
- Escalating geopolitical tensions, including US-Iran developments
- Weakening U.S. dollar and “Sell America” trade
- Uncertainty over Federal Reserve independence and rate policy
In India, these global pressures, combined with rupee weakness, pushed domestic gold prices to record highs above ₹1.4 lakh per 10 grams.
Practical Tips to Track Gold Price Movements
Tracking gold prices effectively requires more than watching daily rate changes. By combining macroeconomic signals, technical indicators, and currency trends, investors can better understand market direction and make more informed, timely decisions.
- Monitor macro indicators: Inflation data, DXY, interest rates
- Use technical indicators: Moving averages, RSI, MACD
- Follow central bank actions: Gold reserve data and policy signals
- Diversify gold exposure: Physical gold, ETFs, digital gold, SGBs
- Track INR movements: Currency depreciation magnifies domestic prices
Combining technical and fundamental analysis improves decision-making.
Also Read: Dollar Hits a Four Year low in Jan 2026
Conclusion
Gold price movements are driven by clear and repeatable indicators, inflation, currency weakness, central bank policy, geopolitical risk, and supply dynamics. While short-term fluctuations are inevitable, long-term trends show that gold consistently protects wealth during periods of uncertainty.
For investors, the key is not predicting exact price levels, but recognizing early signals of a rising trend. By tracking these indicators and understanding historical patterns, gold can remain a powerful and reliable component of a diversified investment portfolio.

Download the Buddy Loan App Now!
One solution to each of your financial needs at your fingertip.

Scan to download now