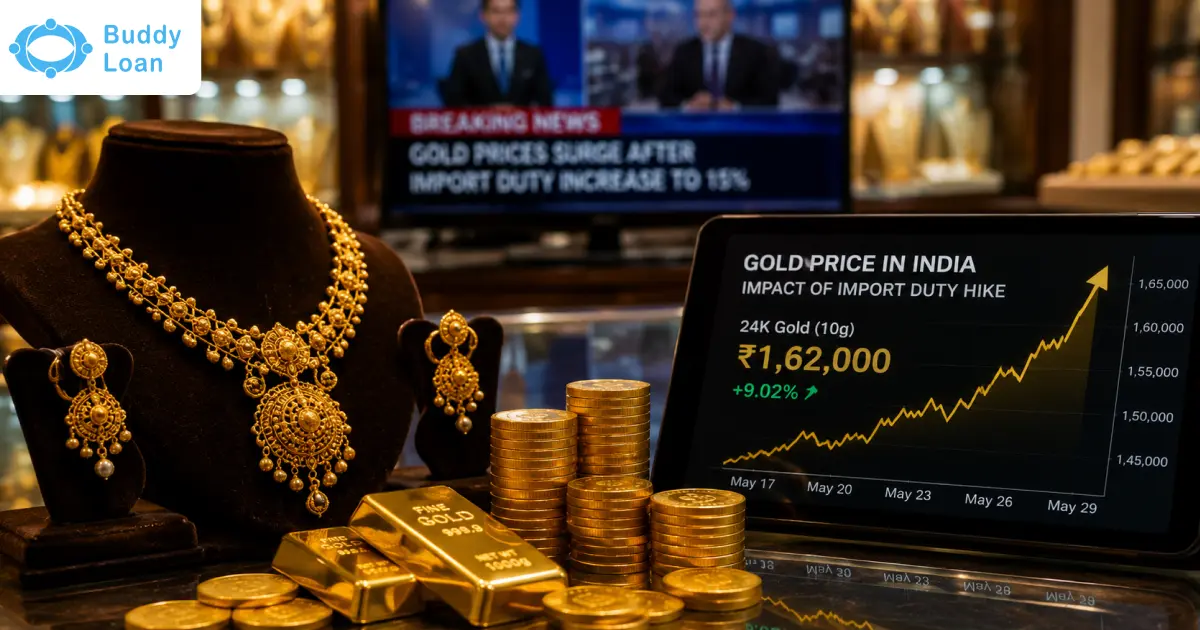
After a vertical ascent over the past seven days, the gold and silver rates have entered a phase of high-altitude consolidation on February 24, 2026. To the untrained eye, today’s minor retreat might look like a reversal. However, for the seasoned strategist, this is the market’s way of catching its breath after a historic sprint.
Since February 17, we have witnessed one of the most aggressive weekly expansions in recent memory, driven by systemic shifts in global liquidity and a sharp decoupling of precious metals from traditional equity benchmarks.
Today’s Gold & Silver Rates Snapshot
As of mid-morning trade on February 24, 2026, the domestic bullion market is reflecting a slight ‘mean reversion’. Gold rates have retreated from the high touched yesterday, while silver is showing a similar, although more volatile, cooling pattern. The indicator of gold price rise today is technical profit-booking on the MCX and a marginal stabilisation in the US Dollar Index (DXY) following a period of extreme weakness.
The following tables provide a granular breakdown of the current market rates across India. These figures account for the 6% basic customs duty and the 3% GST, providing the final retail landing cost.
Gold Price Benchmarks (24K Fine Gold – 999 Purity)
While the gold rate has dipped roughly 0.60% since yesterday, it remains nearly 6% higher than its position exactly one week ago.
| Weight | Today’s Price (24K) | Price Change (vs. Yesterday) |
| 1 Gram | ~₹16,114 | ~ -₹97 |
| 8 Grams | ~₹1,28,912 | ~ -₹776 |
| 10 Grams | ~₹1,61,140 | ~ -₹970 |
| 100 Grams | ~₹16,11,400 | ~ -₹9,700 |
| 1 Kilogram | ~₹1,61,14,000 | ~ -₹97,000 |
Get Personal Loan Online Up to ₹35 Lakhs
By entering your number, you're agreeing to Terms & Conditions & Privacy Policy.
Silver Price Benchmarks (999 Fineness)
Silver’s weekly performance has been nothing short of drastic. Despite a 0.43% dip today, the metal has gained over ₹34,000 per kilogram in just seven days.
| Weight | Today’s Price (Silver) | Price Change (vs. Yesterday) |
| 1 Gram | ~₹265.53 | ~ -₹1.14 |
| 8 Grams | ~₹2,124.24 | ~ -₹9.12 |
| 10 Grams | ~₹2,655.30 | ~ -₹11.40 |
| 100 Grams | ~₹26,553 | ~ -₹114 |
| 1 Kilogram | ~₹2,65,530 | ~ -₹1,140 |
Read more about Silver Price Forecast 2026
Gold Rates by Purity
The correction is visible across the entire purity spectrum. For a jewellery consumer, the 22K and 18K rates offer a slightly better entry point today compared to the peak seen on February 23.
| Purity Level | Price (per gram) | Absolute Change | Percentage Change |
| 24K Gold (999) | ₹16,114 | -₹97 | -0.60% |
| 22K Gold (916) | ₹14,771 | -₹89 | -0.60% |
| 20K Gold (833) | ₹13,428 | -₹81 | -0.60% |
| 18K Gold (750) | ₹12,086 | -₹73 | -0.60% |
| 14K Gold (583) | ₹9,400 | -₹57 | -0.60% |
Pro Tip: The MCX-LBMA Spread is currently trading at a discount of ~₹435. This is a rare occurrence during a bull market and suggests that the domestic sell-off is slightly more aggressive than the global spot movement. This local discount often precedes a fresh wave of physical buying by large jewellery houses looking to replenish inventory at a lower landed cost.
Bought Gold? Check Purity Using BIS Care App
Gold & Silver Price Movement Summary
The data from February 24, 2026, tells two different stories.
- The Gold Story: Gold is currently trading at ₹1,61,140 per 10 grams. While this is a 0.60% drop from yesterday’s ₹1,62,110, it is a massive leap from the ₹1,52,140 recorded on February 17. We are seeing a ‘higher low’ formation on the daily charts, which is a classic bullish indicator.
- The Silver Story: Silver has exhibited a drastic weekly surge. On February 17, silver was priced at ₹2,31,230 per kg. Today, even after a slight dip, it stands at ₹2,65,530. This 14.8% weekly explosion is driven by a short squeeze on the Comex and a sudden spike in industrial demand for 2026-gen solar photovoltaics.

Why Gold & Silver Rates Moved Today
The mechanics of today’s price action are governed by three specific catalysts:
(please note that these are variables and are solely the reason for today’s bullion rate changes).
- Technical Resistance at $5,200: On the US Comex, gold hit a massive psychological resistance level near $5,250 per ounce yesterday. Markets rarely breach such significant round numbers on the first attempt. Today’s dip to $5,193 is a standard retest of the previous breakout zone.
- The 10-Year Yield Bounce: After a week of sliding, the US 10-year Treasury yield saw a minor dead-cat bounce today, rising to 3.95%. This put immediate, albeit temporary, pressure on non-yielding assets like gold and silver.
- Profit Booking in Silver: Given that silver gained nearly 15% in a week, institutional traders are taking chips off the table. This is a healthy deleveraging process that prevents the market from entering a “bubble”.
Impact of Today’s Bullion Rate Changes
There are some immediate impacts for the gold and silver rate dip of today.
- Jewellery Retail Sentiment: The slight fall today has triggered a buying reflex in the domestic retail market. After the shock of seeing gold cross ₹1.60 Lakh, a ₹1,000 dip per 10 grams is being perceived as a discount by wedding-season shoppers.
- Gold Loan LTV Ratios: The massive weekly rise has significantly boosted the collateral value of existing gold loans. However, today’s minor dip serves as a reminder to NBFCs to maintain a conservative Loan-to-Value (LTV) buffer to protect against intraday volatility.
- Digital Gold Liquidity: We are seeing high transaction volumes on digital gold platforms today. Investors who missed the Feb 17 rally are using today’s 0.60% dip to start Systematic Investment Plans (SIPs), fearing that the price might soon head toward the ₹1.70 Lakh mark.
Also read: EMI vs SIP: Choose the Right Financial Path
Gold & Silver Rates Trend of Last 7 Days
The trend below highlights the V-shaped recovery and subsequent breakout that defined the third week of February 2026.
| Date | 24K Gold (per 10g) | Silver (per 1kg) | Market Sentiment |
| Feb 24, 2026 | ₹1,61,140 | ₹2,65,530 | Consolidation |
| Feb 23, 2026 | ₹1,62,110 | ₹2,66,670 | Peak Euphoria |
| Feb 22, 2026 | ₹1,57,400 | ₹2,53,000 | Bullish Momentum |
| Feb 20, 2026 | ₹1,57,400 | ₹2,53,000 | Breakout |
| Feb 19, 2026 | ₹1,54,900 | ₹2,43,000 | Recovery |
| Feb 18, 2026 | ₹1,55,800 | ₹2,44,500 | Sideways |
| Feb 17, 2026 | ₹1,52,140 | ₹2,31,230 | Local Bottom |
Get Personal Loan Online Up to ₹35 Lakhs By entering your number, you're agreeing to Terms & Conditions & Privacy Policy.
Is This Price Drop the Cue to Buy More?
In the world of bullion, ‘price’ is what you pay, but ‘value’ is what you hold.
Today’s dip can be viewed as a classic (yet sarcastic) entry point. When an asset class rises by 6% to 14% in a single week, a 0.5% correction is not a sign of weakness; it is a sign of a sustainable trend. For the long-term investor, the drastic rise in silver suggests that the metal is entering a new price regime, likely driven by its dual role as a monetary hedge and an industrial essential.
Gold rates, meanwhile, is cementing its position as the ultimate insurer against 2026’s inflationary pressures. If you are looking to accumulate, today’s minor retreat offers a softer entry than yesterday’s peak. However, the strong-hand approach suggests staggered buying — allocating 30% of your intended capital today and keeping the rest for any potential retest of the ₹1,58,000 levels.
Market Insight: The Silver Squeeze of 2026
The most significant takeaway from today’s data is the resilience of silver. Despite the daily dip, the fact that silver is holding above ₹2.65 Lakh, after being at ₹2.31 Lakh just a week ago, points to a structural supply deficit. In the Indian context, the currency lever is also at play. Even if global silver prices consolidate, any further depreciation of the Rupee against the Dollar will push domestic silver toward the ₹3.00 Lakh milestone.
We are witnessing a de-dollarisation of the silver trade, where physical demand in the East is now the primary price setter, overriding the paper shorts on the Western exchanges.
Conclusion and Key Takeaways
The bullion market on February 24, 2026, is a testament to the power of structural bull markets. While the daily tickers show a red flash, the weekly and monthly charts are screaming green. The market has a strong hand that is currently crushing the speculative froth, but it offers a soft flower of opportunity to the patient, long-term accumulator.
As we move toward the end of the quarter, the focus will remain on US Fed signals and the evolving geopolitical landscape, both of which continue to favour the safe haven complex.
- Weekly Dominance: The Gold rate is up ~6% and Silver rate is up ~15% over the last 7 days, overshadowing today’s minor 0.6% dip.
- Technical Floor: ₹1,60,000 for gold and ₹2,60,000 for silver have emerged as the new psychological floors for the market.
- Industrial Tailwinds: Silver’s drastic performance is increasingly decoupled from gold, suggesting a unique industrial-led breakout.
- Strategic Stance: Today is a day for disciplined accumulation rather than panic selling. The trend remains firmly upward.

Download the Buddy Loan App Now!
One solution to each of your financial needs at your fingertip.

Scan to download now


Disclaimer:
This analysis is provided for educational and informational purposes only. It does not constitute a solicitation, recommendation, or promotion to invest in or trade any specific stocks, commodities, or financial instruments. The insights shared here aim to explain the underlying mechanics of price fluctuations and potential market steps. Bullion trading involves significant risk; individual financial choices based on personal experience and professional consultation remain superior. This content serves purely as a guide of details and not as a directive for capital allocation.
Download the Buddy Loan App Now!
One solution to each of your financial needs at your fingertip.
Scan to download now